There’s more tweaking to do inside the Vice data set of big-city police-shooting incidents, though some tweaks are more concessionary than ameliorative. The abundance of NAs flecking the sheet’s fields is not a matter of slipshod data collection; Vice’s preface to the data recalls the issues the site experienced with respondent cooperativeness and data quality. But missing data are missing, and so the fact that shooting victim ages (SubjectAge, in column H) don’t appear for more than 53% of incident cases remains a fact; and while of course the available ages of the other approximately 2000 victims amounts to a sizeable cohort, one wonders if the absent data inflict a sampling skew on the ages. I suspect they don’t, but the question should be recorded.
Pivot-tabling the age data, then, will deliver a mixed yield, e.g. NA along with N/A, U and UNKNOWN, two instances of the label Juvenile, 29 hard-coded #REF! entries that seem to mark a formula gone wrong, and a few hundred records reporting estimated ages in spanned swaths that are no less textual – 0-19 and 20-29, for example. Again, the data sources are uncontrollably heterodox, but a decision about these data needs to be made – which might consist of a determination to simply ignore the age parameter, or alternatively of course to proceed with the usable information in hand.
And missing data likewise compromise the SubjectRace field. Submitting this pivot table for consideration:
Rows: SubjectRace
Values: SubjectRace
SubjectRace (again, % of Column Total)
Churns out these distributions:
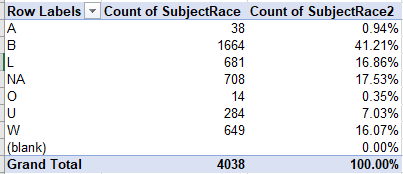
The disproportion of Black victims is clear, but of course remains to be explained by a larger context framed by prior variables, e.g. number of overall incidents, number of alleged perpetrators alleged to have been carrying a weapon, etc., but again note the raft of NAs, Us, and blanks disqualifying more than 30% of the entries from the analysis (the blanks simply aren’t counted above at all). (I’m assuming, by the way, that A signifies Asian and O Oriental. But even if so, I don’t know if those categorizations denote distinct or problematically redundant ethnic niches.)
But in any case, there are things to be learned from the data, their shortcomings notwithstanding. For example, we could look at the relationship of victims’ race to shooting incidents resulting in a fataility. In that connection we could assemble this pivot table:
Rows: SubjectRace
Columns: Fatal
Values: SubjectRace (% of Row Total; filter out (blank) and turn off Grand Totals)
I get:

The results are fairly startling. We have already learned that the absolute number of black victims far outpaces the other groups, but the ratio of fatal police shootings by race involving a white victim – 51.27% – is far higher than that for black or Latinos, a less-than-“intuitive”, literally provocative outcome.
How might these proportions be accounted for? If in fact police may make swifter resort to their weapons in confrontations with black suspects – if – then perhaps white suspects are shot and killed for compelling, truly defensible reasons, i.e., more of them might be armed, or at least seen as such?
In view of that question we could thus introduce a third variable, SubjectArmed. Because three-variable pivot tables complicate readability, we could assign a Slicer to the field instead:
Rows: SubjectRace
Columns: SubjectArmed
Values: SubjectRace (count, % of Row Totals)
Slicer: Fatal
Ticking F in the Slicer for Fatal, I get:

Remember that the column entries above comprise the SubjectArmed items – No, Not Available, Unknown, and Yes.
We see that, so far as the data can take the question, white fatalities are actually less likely to be armed than black or Latino victims. But because the figures for B incur so many NAs and Unknowns, the conclusions are obscured. Indeed – as a consequence of the missing data, we see that white victims are also more likely to be armed.
It could also be noted that 153 fatal shootings received an NA race code, and another 80 were assigned a U. One wonders if these could be inferentially mapped against and compared with the known-race victim distributions, though that supposition is a highly adventurous one.
But turn to the OfficerRace and OfficerGender fields and you’ll encounter a new set of challenges, only one of which are the 450 OfficerRace cells containing no officer information at all, and the not-inconsiderable number of other cells bearing the code H. Given the cities with which the code is associated I’d guess H stands for Hispanic, but how or if that letter means to distinguish itself from L I’m not sure, particularly in light of the absence of H data from the SubjectRace field.
OfficerRace and OfficerGender accompany the straightforwardly quantified NumberOfOfficers field, and attempt to code the ethnicities of incident-participant officers – in a single cell. That is, a cluster of items, each of which would typically populate its own record, here share one cell’s space.
Moreover, a good many cells replace the elliptical W and B entries with WHITE or BLACK respectively, a set of inconsistencies that have to be dealt with as well. We could dispose of these latter anomalies, however, via batch of finds and replaces, e.g., exchanging a W for WHITE.
But it’s the multi-item cells that call for a deeper think. If, for example, we wanted to break out the officer totals by ethnicity, say white officers for starters, we could select OfficerRace, name it offrace and enter, somewhere:
{=SUM(LEN(offrace)-LEN(SUBSTITUTE(offrace,”W”,””)))}
I get 2329 – but how? Those tell-tale curly braces can only mean one thing: an array formula is at work, and what it’s doing first is first summing the aggregate length of the cells committed to offrace, and from that default baseline substracting a revised aggregate length – achieved by substituting nothing, as it were, for every instance of a W throughout the offrace range (remember that SUBSTITUTE replaces every instance of the searched-for text, not merely the first one), and totalling the lengths these. The math, then, yields the 2329, and to empower the process you could do something like this: enter these race identities in Q2:Q7 respectively: W,B,L,A,H,NA. Follow with
{=SUM(LEN(offrace)-LEN(SUBSTITUTE(offrace,Q2,””)))}
in R2, and copy down accordingly. I get

First, of course, the numbers need to be weighted alongside the aggregated ethnic representations of the police forces studied, but we don’t have that information here. But a more proximate operational concern looms above: At least two of the results are wrong.
For one thing, the formula’s search for NA (assuming that search term is in Q7) must read instead
{=SUM(LEN(offrace)-LEN(SUBSTITUTE(offrace,Q2,” “)))}
What’s different about the above emendation is the space “ “ supplying the final argument in the expression. Because we need to substitute here for two characters – the N and the A – their replacement need comprise one character, in order to foster a differential of one for each original NA. Thus my redone substitution returns 1174, or precisely half the original, errant NA total.
But the other false start is considerably trickier. The count of 1299 for A enormously overstates the incidence of that code, because my formula also registers appearances of NA (and other entries as well) which, after all, contain that selfsame A. The task, then, is to account only for isolated A’s, disassociated from any other entries in the field that also happen to contain the letter – and there are other entries, for example AI/AN, and even one instance of Multi-Racial. The formula as it stands will substitute those A’s too, and be duly counted.
One far-from optimum end run around the problem would be something like this:
{=SUM(LEN(offrace)-LEN(SUBSTITUTE(offrace,Q5,””)))-R7}
That formula in effect calculates all A appearances and simply subtracts the NA total from them, which holds down cell R7. It yields a far more plausible 125 but remains inexact, owing to the other A-freighted cells that continue to be counted above. What could have been done, then: a seeing to it that every coded race/ethnicity consisted of unique letter(s).
But I’d allow I’ve done enough deep thinking for one post.

One Response to “US Police Shooting Data, Part 2: A Civilian’s Review”