Numbered among the additional conclusions we can draw from the New York Regents data is a natural next question from the aggregate test averages we reckoned last week, answered by kind of reciprocal finding: namely, the aggregate fail rates. Guided by the concerns about weighting we sounded in the previous post, I’d allow that a calculated field need be applied to the task here too, a field I’ve called PctFail.
But before we proceed we again need to contend with the not insignificant number of records who, for apparent reasons of confidentiality, won’t count their fewer-than-five students, replacing the totals with an “s”. Thus I tapped into column N, called it NFail, and entered in N2:
=IF(J2=”s”,0,K2)
The formula assays the relevant cell in J for an “s”; if it’s there, a 0 is supplied. Otherwise the value in K – the Number Scoring Below 65 – is returned.
Again, we’ll copy that formula down N and proceed to calculate the PctFail field:

Once effected, this simple pivot table, abetted by the All Students Slicer selection we ticked last post, opens the story:
Rows: Year
Values: PctFail (formatted here in Percentage mode to three decimals)
I get:

The failure rates are substantial, a near-ineluctable follow-on from the overall score averages settling in the 68 range (remember that 65 passes a Regents exam).
But you’ll want to know about failures by Regents subjects, too. Sight unseen, you’d expect appreciable variation among the test areas, and that drill down can tool its way into the data via the Regents Exam field, e.g. something like this:
Rows: Regents Exam
Columns: Year
Values: PctFail (formatted similarly to the table above)
I get:

And variation there is, some more provocative than others. You’ll note the massive leap in failure rates for English and Geometry from 2015 to 2016, a determined, ascending slope of failures for Algebra2/Trigonometry, and a restitutive, noteworthy shrinkage in failures for Common Core Algebra. (The Common Core tests are controversial, in part because of their redesign; see this report, for example).
You’ll also want to do something about those error messages. In some cases, the #DIV/0! outcomes simply key the absence of data for the exam, owing to an exam’s discontinuation or later introduction, while the (blank) label appears in virtue of the ten rows that bear no exam name. Should you want to pave over the errors, and you probably do, click anywhere in the pivot table and proceed to PivotTable Tools > Analyze > Options > Options > Layout & Format tab > and tick For error values show:. Enter some appropriate stand-in for #DIV/0!, e.g. — , and click OK. Because the dashes in the 2015 column push far left and look almost as unseemly as the original error message, you may want to select all the Values and align them right. (You could also filter out the blanks.)
Now if you want to crunch failure rates by ethnicity, for example, you’ll again have to reconcile the double-counting character of the fields we described last post. The ethnicities – Asian, Black, Hispanic, Multiple Race Categories Not Represented, and White – have been quartered in the Demographic Variable field, but so have a potpourri of other, disconnected items bound to other Variables, e.g. Female to Gender, English Proficient to ELL Status.
We’ve stubbed our toe against this odd problem in the previous post, in which Excel’s million-record limit has forced records otherwise deserving of their own field into one, messy cosmopolitan column – the one called Demographic Category, itself dispersed into no-less-heterogeneous items in Demographic Variable. It’s a confusing issue, but I think we need to tick Ethnicity in the Slicer now and slide Demographic Category –confined by the Slicer to its ethnic item entries – into Rows. Sweep Year into Columns and you get:

The disparities here are dramatic, and rather self-explanatory – the results, that is, not the accountings of them.
Next opt for Gender in the Slicer:

Women outdo men, a finding that more-or-less jibes with current understandings of gender performance differentials. The female margin, nearly equivalent across 2015 and 2016, pulls away slightly in the following year.
And what of gender outcomes by exam? Slip Regents Exam atop Demographic Category (which has been sliced to Gender) in Rows, and (in excerpt):

And (in second, remaining excerpt):

You’re looking for palpable divergences, of course, but palpable congruences mean something here, too. The decisive female advantages in the Common Core English scores are perhaps notable but not arresting; but their edge in Common Core Algebra does a fair share of stereotype busting, even as males emerge the stronger in Common Core Algebra2. (Important note, the Grand Total pass rates vary by Demographic Category even as the Total Tested remains neatly constant across all Demographic Variables. That’s because the distribution of “s” entries across the Categories isn’t constant.)
There are plenty of other permutations in there, but let’s try one more. Column Q quantifies the number of students in the record whose score achieves what the Regents calls College Readiness (CR), i.e., a 75 in the English Language Regents or an 80 on any Math exam in the system.
And here’s where I have to own up to a bit of spreadsheeting excess. In the previous post I implemented what I termed an NFail field, embodied by its foundational formula – an expression that replaced “s” entries with a 0, the better to factor these into a calculated field. I now understand that those exertions were unnecessary, because Excel will completely ignore an “s” or any other label in any case. Thus here (and last week, too) we can work directly with the Number Scoring CR field in Q. But because we do need to acknowledge the large number of “s” and “NA” entries in Q (NA, because only some Regents’ qualify as CR exams) that will impact any denominator we also need what I call here a CRCounted field to be put in place in the next available column, punctuated by this formula that gets copied down:
=IF(ISNUMBER(Q2),I2,0)
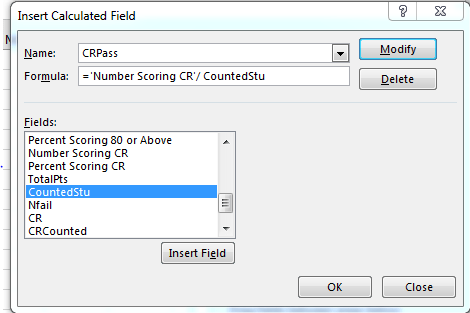
We then need compose that calculated field, which I’m calling CRPass:
Remember here, and for the first time, we’re computing pass rates. This pivot table among others, awaits, under the aegis of the Demographic Category Slicer – Gender:
Rows: Demographic Variable
Columns: Year
Value: CRPass
I get:

Provided I’ve done my homework correctly the results point to a striking spike in CR attainments, a set of findings that calls for some journalistic deep-backgrounding. (Note that the absolute CR numbers are far smaller than the global Total Tested figures, because as indicated above only certain exams march under the CR banner.) We see a small-scaled but real stretching of the female advantage in the pass rates between 2015 and 2017, one that also needs to be sniffed by some nose for news.
Now let my take a break while I double-check my homework. I hear this blogster is one nasty grader.

Leave a comment