You don’t read big data, you analyze it. No one unrolls themselves into their hammock, reaches for their mint julep, and thrills to that page-turner of a 300,000-row data set they’ve been craving to get at all winter. Big data is meant to revel in its bigness, favoring the curious with its possibilities for aggregated, patterned and macro-leveled largesse, and largeness.
But sometimes the revel is in the details. Now and then a big data set comprises a gigantic compound of molecular bits whose very protons might be of sufficient interest to make you put your julep on hold – and I’m thinking about the 59-years of variously memorable hits filling 309,000 rows of the Billboard top 100 workbook, playing its enormous medley here on the data.world site.
As indicated, the Billboard set recollects its chart-toppers all the way back to August, 1958, and if you’re just bursting to know for exactly how many weeks “She Loves You” oooed its way into the listings – and you probably are – or precisely when the epochal “Rapper’s Delight” first hip-hopped onto the rankings and your consciousness (15, and the week of November 10, 1979, respectively; but remember that the Beatles’ own German cover version “Sie Liebt Dich” also checked in for a week at 97 in June, 1964), you’ve assuredly come to the right place.
I don’t know about you, but I think the Billboard data – all 21.6 megabytes of it (i.e., you’ll have to download it yourself) – makes for a cracking good read – but it’s a spreadsheet, after all, and so some intriguing global findings should be in there, too. But as usual, the data need some inspecting before the work gets underway.
Note, for example, that the Peak Position and Weeks on Chart fields installed in columns I and J are, at least in theory, dispensable; one could derive both findings from a pivot tabling of the songs, subjecting Peak Position to a Min in Values, and then applying the song titles themselves to Values, realizing a count that would deliver a Weeks on Chart equivalent. That sparer approach would relieve the data of a slew of redundant entries, e.g. a song’s peak position appears identically for each week in which it appears.
If you’re wondering about the Instance field and what it means, you’re not alone. I originally supposed that it counts the number of times the same chart-bound song was performed by different artists (I use the term loosely), but that conjecture proved a false take. Rather, Instance seems to number a given version’s non-contiguous revisits to the charts. For example, Nicky Jam’s El Amante – a performer and song whose identities draw a pair of blanks in my uncomprehending mind – exhibits six instances; its debut at position 99 in the week of February 18, 2017 was succeeded by its disappearance the following week, only for the tenacious ditty to stage a three-week comeback dating from the week of March 4. Continuing to loll in the high 90s, El Amante submerged once again, before clambering back into 98 on April 4, etc. It last held its place in the rankings until the week of September 2, 2017, concluding its sixth instance – before it fell back into the oblivion it likely deserved.
Note in addition the SongID field, a unique identifier crafted by a concatenation of the entries in Song and Performer. Slightly curious is the retention of the formulas in their cells; their work has been completed, and could be paved over with a Paste > Values routine, an austerity move that serves to reduce the file’s size to 19.5 MB.
And if you’re wondering what purpose a song id might fulfill – that is, what analytical need would spur the assignment of an id to each song – I can think of at least one, one that returns us to an exigency with which I’ve contended before, and not optimally, as it turns out.
If we want to learn how many discrete songs clambered into the top 100 for any particular year we need – again – to do something about the recurring weekly appearances of the same songs, songs we want to count exactly once. I had expressed a similar wish, for example, in my posts on the Supreme Court Voting data, in which I wanted to count unique cases heard by the Court per year. I developed the count by embedding case data into the Rows area, where of course they’re enumerated but one time each. I then moved to analyze that satellite table instead.
But I’ve since learned that the above exertion is unnecessary, thanks to Excel frontliner Chandoo. He inclined my attention to an unassailably more elegant maneuver, that works like this:
But before I demonstrate, recall what I’m aiming to do: I want to pivot table a tabulation of the number of unique songs crashing the charts by year, and as such a prior step need be enacted upon the data before I set the table – I need to release year information from the WeekID field in B. That intention can be effected in several ways, but in the interest of simplicity I’ll scamper to next-available column K, call it Year, and enter in K2:
=LEFT(B2,4)
And copy down the column. That simple device releases the first four characters from each week id, which in every case offers up the year of the song’s chart entry (WeekId is text-formatted, by the way).
When the venerable Create Pivot Table dialog box opens, tick the Add this data to the Data Model box at its lower left (and someone tell the folks in Redmond it should be these data):

That tick activates Excel’s Data Model (which first made itself freely available in the 2013 release), an add-in that enables a number of data-querying enhancements, including the potential for building relational pivot tables. But our interest here is in those unique song titles, and so once you’ve executed the tick and the Data Model loads, advance to the pivot table (notice the slightly modified field list drawn up by the Data Model) and earmark Year for the Rows area. Next show SongID into Values, right-click into Summarize Values by, click More Options… scroll down and…

Wow – Distinct Count; what a concept. Click it, click OK, and I get (in excerpt):
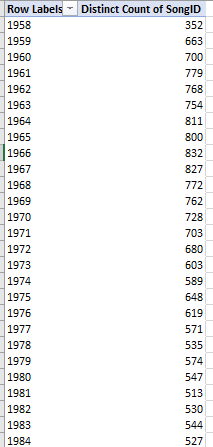
(Note that the 1958 data are partial, encompassing only the last five months of that year. The 2017 listings extend to the end of October.) Subjected to a rudimentary line chart, the slope looks like this:
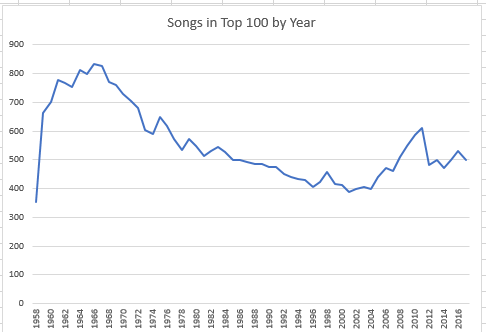
I’m not sure what sociological conclusions beg our attention, but the peak in song numbers in the 60s is marked, as is the decided slump in the ensuing years.
Put it this way: There’s something happening here/What it is ain’t exactly clear.
“For What It’s Worth”; hit the charts the week of January 28, 1967, and stayed there for 15 weeks. Peak position: 7.

Leave a comment