Obvious questions, as we learned in the previous post, don’t always facilitate obvious answers; and if you’re seeking additional cases in point, consider this up-front question we could put to our hurricane-data worksheet: has the average length of storms, measured in days, moved about across the 167 years of data filling the sheet?
By way of a first consideration, what we know won’t answer the question is a dividing of the sheet’s 50,000-plus records by the 1848 individual storms we’ve identified. The quotient that emerges – about 27 – can’t propose itself as the storm duration average in days, because each storm elicited multiple observations of its movement and progress. The very first storm in the data set, coded AL0111851, triggered 14 observations across its four-day span. And its daily observation average of 3.5 tells us that the numbers of recorded observations weren’t constant across days; and so that while 27 represents the average number of observations performed per storm, that figure cannot be divided by some unvarying value to yield an average day count.
We’re also roadblocked from an imaginable alternative for calculating the average duration. We can’t subtract each storm’s start from its finish date, at least not directly, because the pre-1900 storms informing the list resist Excel’s best date-formatting efforts. Enter a date antedating January 1, 1900, and the notation is forced into text mode, e.g. a non-numeric entity that can’t be added, subtracted, and the like.
That famous limitation doesn’t close the door on the task, however, and I can think of a couple ways of poking my foot beneath the transom before it slams. The more elegant of the two rides the idea that a unique count of the dates associated with each storm is coterminous with its duration.
For example- storm AL0111851’s 14 entries post four different dates to the Observation_Date field in column E. (We need to tap into Observation_Date and not the dates vested in the Date field in A, because those latter data are visited by times as well, and thus confound the search for unique dates alone.) Four different dates – assuming they’re consecutive for all the storms, a not imprudent assumption – must signal a storm of four days’ duration.
That the pre-1900 entries among the data don’t qualify as genuine, grade-A certified dates doesn’t matter here. All that concerns us is our capacity for culling one instance of each date, its format notwithstanding.
And to broadcast that possibility to our screens we can once again make productive use of a pivot table’s Distinct Count operation, mobilized by a tick of the Add this data to the Data Model box:

Set the pivot table in motion and organize it thusly:
Rows: Year
Values: Observation_Date (Distinct Count)
Storm_ID (Distinct Count)
I get, in excerpt:
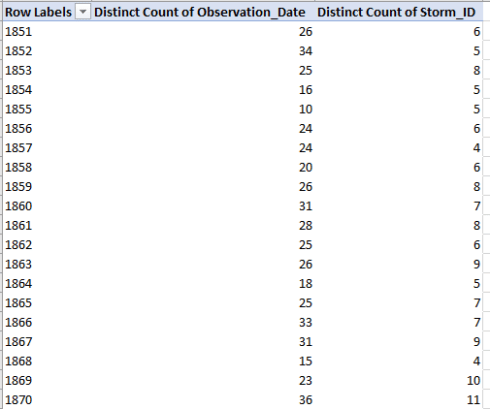
The table thus grabs only one instance of each date and storm ID. From here, however, it appears as if we need to supplement the results with some simple but external formulas, because a calculated field invoking distinct counts – in which the annual counts of the observation dates might be divided by the yearly count of storm IDs – isn’t available to us.
We can opt for a none-too-graceful workaround, then, by entering this extra-pivot table formula in D3 (entering the title Average in D2), lining itself up with the first data row in the pivot table:
=B3/C3
Format the result to two decimals and copy down D (through the year 2017; omit the Grand Total row).
We could also, however, replace Year with the overarching Grouped Year field we had extemporized in the previous post. Try that, and delete the now-excess formulas in D that descend the final 2010 grouped year.
I get:
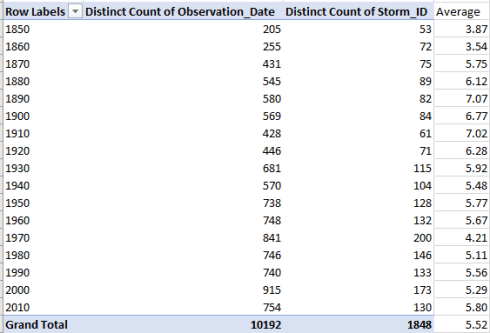
Of course the Average field abuts, but cannot enroll, in the pivot table, and as such can’t be party to a pivot chart. But by selecting A3:A20 and D3:D20 with the cooperation of the Ctrl key as you can select the non-contiguous fields, you can insert a scatter chart with straight lines and markers and power up this chart:

You can right-click the horizontal axis, click Format Axis, and set the Major units interval for 10 as you see above, a decision that will disclose all the grouped years into the chart (note that the scatter chart seems to be preferred here because it honors the numeric status of the X axis data, here the grouped years; a line chart engineers a default treatment of X-axis data as labels. Look here for an instructive discussion of the issue. It’s true, on the other hand, that a conventional line chart could be put into place in this case as well, because the grouped years happen to be equally spaced and so would be indifferent to their label status; but you’d need to edit the axis in the Select Data dialogue box in less-than-obvious ways).
The chart delineates a dip of sorts in average storm duration across time, and so dashes a lurking, laymen’s speculation of mine – that the upheavals wrought by global warming would have served to prolong storm lengths. But ok – I guess that’s why we look at the evidence. (Again, of course, we assume that storm measurement criteria and instrumentation enter the equation as constants across the 167 years, a premise that could be vetted.)
Now for a next task, we could examine the average maximum wind velocities across the grouped years, again with an eye toward any material change. Because the job appears to require a distinctly stepwise solution, in which the wind maximum for each storm needs to be calculated and then followed by an average of the maxima by years, I don’t think a pivot table can deliver an immediate, conclusive result. Here’s what I’d do, then: commission this pivot table:
Rows: Grouped Year
Storm_ID
Values: Observation_Max_Wind
That table looks something like this:

I’d next turn the above results into a data set of my own, whose records could be plowed back into a second pivot table. I’d thus
- Redesign the pivot table into a Tabular mode and likewise tick of Repeat All Item Labels (both options stored in the PivotTable Tools > Design > Report Layout button the Layout button group). Turn off Grand Totals.
- Click anywhere inside the above table, click Ctrl-A to select it in its entirety, and perform a simple Copy> Paste Values upon itself.
You’re left with an unprepossessing data set, divested of all its pivot table appurtenances. But we then proceed to pivot table the data anew:
Rows: Grouped Year
Values: Observation_Max_Wind (Average)
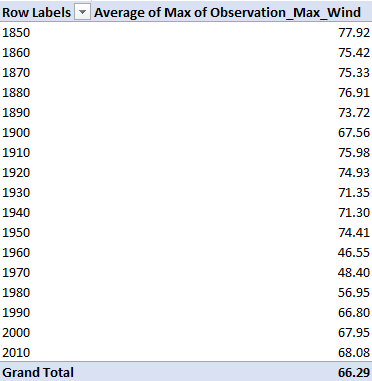
And if we’re charting the above we’re forced to return to a conventional line chart, because you can’t describe a scatter chart from a pivot table, and Excel will duly inform you. Proceeding with the line chart option, then, and indulging in some by-the-book tweaks, something like this emerges:

The plummeting of maximum speeds commencing with the 1960 interval surely demands a closer look, particularly in view of the subsequent movement upwards approximating toward pre-1960 averages. How is the dip to be explained? Observational error or methodological rethink? Actual diminution in velocities?
I don’t know, but just don’t call this post long-winded.

Leave a comment