A certain Nobel laureate once contended you don’t have to be a weatherman to know which way the wind is blowing; but the man from Hibbing, Minnesota didn’t track the loci of hurricanes, a matter about which some meteorological expertise will probably help you make deeper sense of the data.world spreadsheet devoted to gale-force systems churning across the Atlantic Basin (i.e. the Atlantic Ocean, according to Wikipedia). You can whisk the sheet into your laptop by freely enrolling in data.world).
With content drawn in from the US National Hurricane Center the workbook delivers more than 50,000 rows of information about the storms, extending its archival reach back to 1851 and carrying through to November of last year. What this retrospective suggests, but doesn’t prove, is the functional comparability of the data –that mid-19th century observational techniques were the equal of contemporary measures, particularly the readings of wind velocities that feature in the data set (see this resume of the early methodologies). But assuming here that the numbers tally properly, let’s proceed.
For starters we can ask an obvious question, namely, the number of hurricanes distributed by years, a stat that might have something to say about the effects of global warming. But it is here that a less-than-obvious step-back is required, because we need to make sure we know what it is we’re meaning to count.
To wit: those 50,000 records don’t certify a like number of hurricanes; in fact, the data set comprises but 1,848 of those, an incongruity explained by the multiple observations to which the storms were subjected, at apparent six-hour intervals.
Moreover, a look through the Observation_Storm_Type field in column H (whose items are denoted in by the sheet’s data dictionary), lets us know that in fact ten different storm types populate the set. They’re not all hurricanes, then, and so each needs to be counted discreetly.
With those preconditions in mind and in hand (and once you’re attended to the usual column auto-fit) we still want to tug the storm years from the records, perhaps most easily via this formula applied to the Observation_Date data in E, after titling the empty field in M Year:
=VALUE(LEFT(E2,4))
(The little-known ==–(LEFT(E2,4)) will also work.) You’ll note the E entries press together, in text form, year, month, and day data, e.g.
18510625
Thus the four-character extraction effected by LEFT delivers a textual result (that’s what LEFT does); couching the expression in VALUE confers numeric standing to the output, something you’ll want if you need to group the years, for example. Then copy the formula down the M column.
Remember that we’re seeking to break out storm counts by year; but because each storm enters the data set multiple times in virtue of their repeated observations, we’re reintroduced to a problem that greeted us a few posts ago: the mandate to realize a distinct, one-time count of each storm.
We reviewed that technique in that earlier post, and once you’ve nailed it down you can proceed to this pivot table:
Rows: Year
Columns: Observation_Storm_Type
Values: Storm_ID (remember these have been subjected to the Distinct Count operation)
I get, in excerpt (I’ve scrolled to the later years):
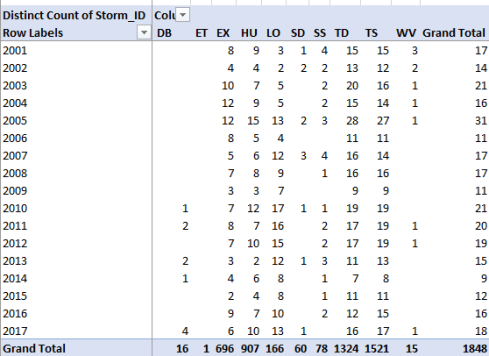
Even a perfunctory scroll down the years’ grand totals will disclose an upswing in overall storm activity, though the slope is far from resolute. Note in addition the first appearances in 1967 of codes SD and SS, both species of what the data call subtropical cyclones, separated by velocities above and beneath 34 knots.
Now in view of the 117 years of storm data spilling down the timeline you may be inspired to group the years, in the service of a fetching concision. That intention sounds honorable, save for a surprise reality check: you can’t group data once you’ve treated the data to a Distinct Count. You just can’t get there from here, a peculiar obstruction that redefines the Distinct Count option in tradeoff terms; you’ll be able return unique instances of records, but at the cost of a forfeited grouping potential (see this discussion on the conundrum).
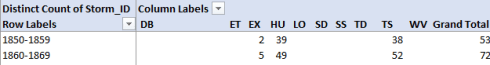
But a grouping Plan B awaits, as suggested by the link immediately above. We could fashion a helper column of sorts – i.e. a new field – that rounds off the values in question, and so poising them for a de facto grouping.
Yes, Plan B requires explanation. This is the idea: if, for example, you determined to group the years above into bundles of 10 (e.g. 1850-59, 1860-69), then if all the years contributing to a given bundle could be redefined, or rounded, to the bundle’s first year – say if 1852, 1856, and 1859 were coarsened into a temporary 1850 – then only one year in the tranche, 1850, would remain for grouping. But of course, a single year doesn’t have to be grouped, and so a data set full of 1850s, 1860s, 1870s, etc. is now readied for a conventional, non-grouped table.
Got that? And the formulaic means for bringing this faux grouping about is supplied by the FLOOR function, which identifies a value closest to, but not greater than, a specified number that’s at the same time divisible by a selected number. Thus
=FLOOR(1858,10)
would yield 1850, because that value is both closest to 1858 without exceeding it, and divisible by 10.
Put that understanding in place and you can name column N Grouped Year or some such, enter in N2
=FLOOR(M2,10)
and copy down the column.
Now this pivot table should do the job, more or less:
Rows: Grouped Year
Columns: Observation_Storm_Type
Values: Storm_ID (Count)
I get:

We see that the row labels portray a de facto grouping; and remember that if you want to more closely emulate the pivot table’s default, hyphenated grouping spans it’s perfectly proper to submit the labels to a manual edit, e.g.
But you’ve noticed a problem, as I did – eventually. The storm-type values populating each row simply don’t comport with the grand totals (and you may have noted much the same in the first screen shot), and it’s the grand totals that are correct. I think this very real discrepancy owes to the fact that the same storms often experience a change in their type across the observations, and as such are counted multiple times (see this related explication).
Moreover, if you double-click any grand total Excel will disgorge up to the first 1000 records within any grouping, in spite of the number reported in the Totals. That is, the double-click that typically divulges just those individual records aggregated by the total seems here beholden to some invariant deep-structural process, one that doesn’t reflect record count directly.
In any case it’s clear the above tables aren’t presentationally acceptable, and you may have to content yourself with this simpler depiction:
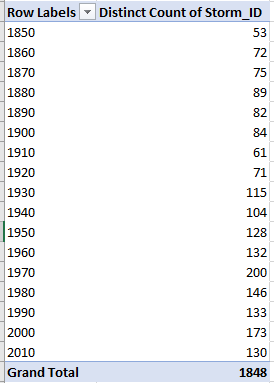
Simpler, but I still don’t understand what each storm type means.
You see, Mr. Dylan, sometimes you need to be a weatherman.

Leave a comment