There’s another parameter-in-waiting pacing behind the Wayne Gretzky goal data, one that might be worth dragging in front of the footlights and placed into dialogue with the Date field in column B. National Hockey League seasons bridge two calendar years, generally strapping on their blades in October and unlacing them in April. For example, Gretzky’s last goal – time-stamped March 29, 1999 – belongs to the 1998-1999 season, encouraging us to ask how those yearly parings might be sprung from the data, because they’re not there yet.
Of course, a catalogue of Gretzky’s season-by-season scoring accumulations is no gnostic secret; that bundle of information been in orbit in cyberspace for some time (here, for example), and so developing those data won’t presume to teach us something we don’t already know. But the seasonal goal breakdowns could be joined to other, more putatively novel findings awaiting discovery among the data, and so the exercise could be justified.
So here’s my season-welding formula. Pull into next-available-column R, head it Season, and enter in R2:
=IF(MONTH(B2)>=5,YEAR(B2)&”-“&YEAR(B2)+1,YEAR(B2)-1&”-“&YEAR(B2))
We’re looking to concatenate two consecutive years, and so the formula asks if the month of any given entry in B equals or exceeds 5, or May, or falls beneath that value. If the former, the year in B is joined to the following year, via the +1 addendum. If the month equals or postdates May, then the preceding years, operationalized by the -1, is concatenated with the year returned in the B column.
The formulas seemed to work, but as a precision check I rolled out this simple pivot table:
Row: Season
Values: Season (count, of necessity; the data are textual. The values should denote goal total by respective year).
I wound up with this, in excerpt:

Cross-referencing the results with the Gretzky goal data in the above hockey-reference.com link yielded a pleasing equivalence across the years.
Now for some looks in earnest at the data. Starting simply, we can juxtapose Gretzky’s goals scored at home to the ones he netted in away games:
Row: Home/Away
Values: Home/Away (count)
Home/Away (again, % of Column Total)
I get:
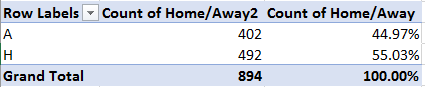
We learn that Gretzky scored a palpable majority of his goals at home, but we’d expect as much. As in nearly all team sports, NHL teams enjoy the proverbial home advantage, winning about 55% of the time – a near-equivalence to Gretzky’s ratio. That is, if home teams prevail disproportionately then their goal totals should exhibit a kindred disproportion, kind of. One difference with Gretzky, of course, is that he simply scored more of them.
And does the distribution of his goals by period pattern randomly? Let’s see:
Rows: Per (for Period)
Values: Per (Count)
Per (% of Column Totals)
I get:
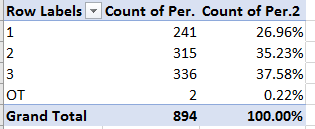
Gretzky’s production appears to mount in games’ later stages (OT stands for the overtime period), but that finding needs to be qualified on a number of counts. We’d need first of all to track Gretzky’s average presence times on the ice; that is, was he deployed more often as games advanced toward their denouements and his valuable self was sent ice-bound at clutch time? And we’d also need to plot Gretzky’s goal timings against the league averages for such things; and while I haven’t seen those data, we can assume they’re out there somewhere.
Next, it occurred to me that a look at the winning percentages of games in which Gretzky scored might prove enlightening, once the task was properly conceived. Remember that, as a consequence of his numerous multi-goal flourishes, Gretzky’s goals scatter across far fewer than 894 games. The idea, then, is to fashion a discrete game count across which the goals were distributed; and that sounds like a call for the Discrete Count operation we’ve encountered elsewhere (here, for example). Once we isolate the actual-game totals – which should be associated uniquely with game dates – our answer should follow.
And this pivot table seems to do the job, enabled again by a tick of the Add this data to the Data Model box:

Rows: Result
Values: Date (Distinct Count, % of Column Total)
I get:
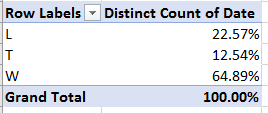
What have we learned? Apart from the up-front factoid that Gretzky scored in 638 of the 1487 games he played across his NHL career (638 is the numeric Grand Total above, before it was supplanted by the 100% figure in the pivot table; note Gretzky also appeared in 160 games in the World Hockey Association), we don’t know how his when-scoring 64.89% win percentage compares with his teams’ success rate when he didn’t score. I don’t have that information, and don’t know where to track it down. But it too is doubtless available.
For another analytical look-see, we can ask if Gretzky’s goals experienced some differential in the number of contributory assists that prefaced them. That is, players (up to two of them) whose passes to a teammate conduce toward the latter’s goal are rewarded with an assist; and the question could be asked, and answered here, if Gretzky’s assist-per-goal average fluctuated meaningfully. We might to seek to know, for example, if during Gretzky’s heyday his improvisatory acumen freed him to score more unaided goals than in his career dotage, when he may have been bidden to rely more concertedly on his mates.
Since two Assist fields, one for each of the two potential per-goal assists, accompany each goal, the simplest way perhaps to initiate our query would be to enter column S, title it something like AssistCount, and enter in S2:
=COUNTA(J2:K2)
And copy down. That insurgent field readies this straightforward pivot table:
Rows: Season
Values: AssistCount (average, formatted to two decimals)
I get:
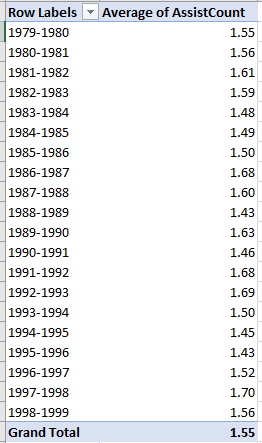
Not much pattern guiding the data, but if you want to group the seasons in say, five-year bins, remember that because the season entries are purely textual you’ll have to mouse-select five seasons at a time and only then successively click the standard Group Selection command, ticking the collapse button as well if you wish:
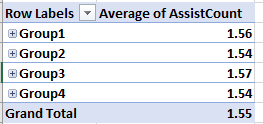
Even here, then, the variation, is minute – strikingly so.
Now for a last question we could ask about those teammates who were literally Gretzky’s most reliable assistants – that is, the players whose assist counts top their collaborative pairings with the Great One. The problem here is the two-columned distribution of the assist names, one for the first assist on a goal, the other for the (possible) second. I don’t know how a pivot table can return a unique complement of names across two fields simultaneously, preparatory to a count. If you do, get back to me; but in the meantime I turned again to the Get & Transform Data button group in the Data ribbon and moved to unpivot the data set via Power Query, by merging only the assist fields, e.g.:
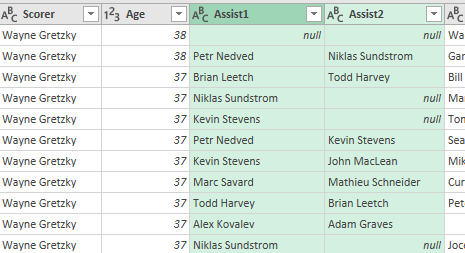
By selecting Assist1 and Assist2 and advancing to Transform > Unpivot Columns and Home > Close and Load the result looked like this, in excerpt:

And of course you can rename Attribute and Value, say to Assist and Player.
Once there, this pivot table beckons – after you click TableTools > Tools > Summarize with Pivot Table:
Rows: Player
Values: Player (Count, sort Highest to Lowest)
I got, in excerpt:
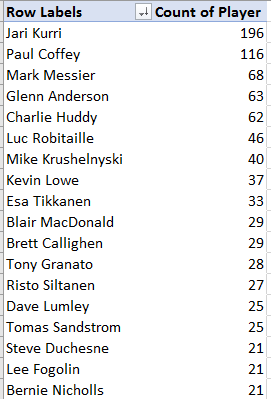
Nearly 22% of Gretzky’s goals received a helping hand – at least one wrapped around a stick – from his erstwhile Edmonton Oiler and Los Angeles King colleague Jari Kurri, no scoring slouch either with 601 goals of his own – a great many doubtless the beneficiary of a Gretzky assist. Then slip the Assist field beneath Player in Rows and:
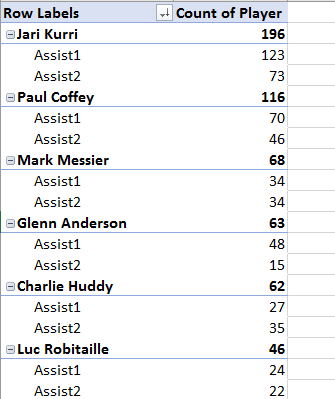
Now we learn that more than 60% of Kurri’s assists were of the proximate kind; that is, he was the penultimate custodian of the puck, before he shipped it to Gretzky for delivery into the net.
Now that’s how you Kurri favor with the Great One.

Leave a comment