We’ve looked at civilian complaints about police conduct before – about three years ago, in fact, when I reviewed complaint data collected for the city of Indianapolis; and I’ve had to refresh my memory about that analytical encounter because a visit to Philadelphia’s open data site brought me to a similar, but not identical, record of allegations against the local constabulary. Indeed – a wider, cross-city study of how civilian complaints are conceived and organized might make for a most instructive, if subsidiary, comparative survey of spreadsheet construction.
But what of the Philadelphia complaints? In fact, two spreadsheets detail the histories here:
The first, ppd_complaints, straightforwardly gathers the incidents into five fields via a neatly-sequenced id scheme, and Its dates received in column B are genuinely quantified beaides. You’ll want to auto-fit columns B and D, but probably not E, bearing the text-expressed summaries of complaints; because no field adjoins its right edge an auto-fit won’t realize any gain in visibility there. The data appear to span the complaints for 2015-18 in their entirety, and tack on complaints for the first month of this year as well (at least through January 30). Thus an obvious first reconnoiter would step us through complaint totals by year:
Row: date_received (Year)
Values: date_received (Count)
I get: 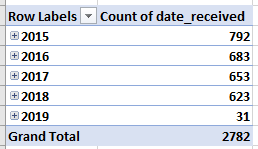
We see that civilian complaints have slackened steadily across the yearly bins, down 21% from their 2015 peak. Still, the January 2019 total of 31 seems low, projecting linearly for the year to about 360. But could it be, rather, that Januarys experience fewer complaints?
Of course we can answer the question by regrouping the complaint numbers both by year and month and shifting the month parameter (curiously and misleadingly holding fast to the date_received field name) into Columns:
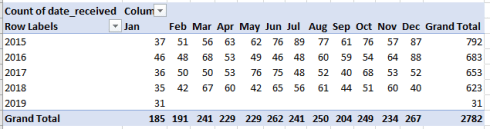
We see then that January is something of a slow month for complaints, although 2019’s lowest reading suggests (but only suggests) that this year may drive the downward curve still further down its axis. Yet the figures for the contiguous December trend far higher – though a highly disproportionate accumulation of complaints dated the 31st of that month seem to prevail. Of the 267 December entries, 63 are time-stamped the 31st, even as chance would have projected a complaint total of around 9.
I arrived at the 63 by installing a set of temporary set of formulas in the next-available F column (don’t be fooled by the encroaching text in E – F is in fact free), starting with this one in F2:
=IF(AND(MONTH(B2)=12,DAY(B2)=31),1,0)
The formula asks if a given date evaluates both to the 12th month (December) and the month’s 31st day. Copy down, add the 1’s, and you get 63.
Is the skew a precipitate of some bookkeeping maneuver designed to hem complaints into a year about to elapse? I don’t know, but someone’s story-seeking antenna should be wagging madly. Indeed – 31 of the 87 December complaints lodged in 2015 fell on the 31st, a clustering that should have you reaching for your probability tables, and 17 of the 88 2016 petitions were similarly dated. That the December 31st numbers slinked back to 8 and 7 in 2017 and 2018 suggest in turn that some sort of correction was introduced to the archiving routine, but that speculation is exactly that.
We could continue and cross-tab complaint type of incident – what the worksheet calls general_cap_classification – by year, and because the classes outnumber the years I’d slide the latter into Columns for presentational fitness, plant general_cap_classification into Rows, and reprise the latter into Values. I get:
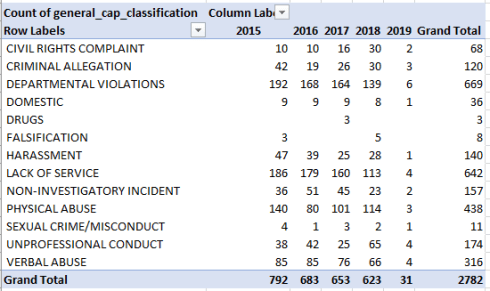
The categories beat out a relatively constant distribution, by and large, though Civil Rights Complaints – their small numbers duly noted – seem to have spiked in 2018. It should be added that the free-text precis of complaints in the summary field incline toward the vague, e.g., a civil-rights submission in which “…they were treated unprofessionally by an officer assigned to the 18th District,” a manner of understatement that could do with some expository padding (note too that the district references for the filings in the district_occurrence field report multiples of the actual district number, e.g. 1800 for 18).
But remember there is a second complaint worksheet among the Philadelphia holdings, ppd_complaint_disciplines, one that historicizes the same complaints and bears identical ids, but per a different complement of defining parameters. Here the complaints identify the race and gender of the officers charged, along with the disposition of the allegation brought against them (investigate_findings). Thus two sheets instigate a next question: since the sheets recall the same incidents, could they not have been consolidated into a single workbook, with each record roping in the fields from each sheet?
That question is a fair one indeed, but I think the Philadelphia data compilers opted for two sheets over a single, unifying rendition is because ppd_complaint_disciplines comprises multiple references of the same complaint id. Because a given complaint may have been levelled at several officers the data for each officer are set down distinctly, aggregating to 6312 records, about 3500 more than the ppd_complaints sheet in which the complaints are recorded uniquely. If each of these were to be matched with the complaints cited in the latter, those complaints would in many cases appear several times – once each for every officer charged in the incident, and those redundant citations might read awkwardly. But those reiterations aren’t necessarily superfluous, because some complaints triggered different charges.
The very first complaint entry, for example, 15-0001, is enumerated four times in the ppd_complaint_disciplines sheet, corresponding to the four actual complaint entries registered for the incident. But it gets a bit messier than that, because the four complaints in fact reference only two discrete officers, who are “named” in the officer_id field. It’s clear in this case that two charges were preferred against each, an recognition that uncovers another complication in turn: the allegations_investigated field discloses three Departmental Violation charges, and another brought for Verbal Abuse.
Yet 15-0001 is described in the ppd_complaints sheet as an instance of Departmental Violations only. For another example 15-0005 is named in that sheet as a case of Physical Abuse, even as the one officer charged in ppd_complaint_disciplines incurred two complaints, one for Criminal Allegation, the other for Harassment.
It’s possible, then, that because each of a set of multiple charges for the same complaint could be regarded independently, one workbook might suffice, with perhaps the date_received and summary fields appended to the others in ppd_complaint_disciplines.
In that light it should also be noted that the Indianapolis data at which I looked earlier works with but one workbook, featuring multiple complaint records as well as date information. Perhaps Philadelphia could have done the same.
But I’m not complaining.

Leave a comment