Now that I’ve spoken my piece about the putative redundancy of the two Philadelphia civilian police complaint workbooks, fairness insists that I actually take a look into the data that’s roosted inside worksheet number two – because there are findings to be found in there, in spite of all.
That book, ppd_complaints_disciplines, concentrates its gaze on the officers against whom civilians preferred a grievance. The complaints are additionally parsed into the districts in which the alleged offenses were perpetrated, and class the complaints along with their dispositions.
Once we’ve widened the fields via the usual auto-fit we see that a good many of the complaint incidents identify multiple officers, as well as different allegations. We could then move to determine, for starters, the average number of allegations lodged per complaint. But that simple-sounding intention isn’t realized quite so straightforwardly, because we need to isolate the number of unique complaint ids in column A before we divide them into all the complaint particulars; and the elegant way out would have us travel here, to this array formula:
=COUNTA(A2:A6313)/SUM(1/COUNTIF(A2:6313,A2:6313))
The denominator – or rather the pair of denominators commencing with the SUM function – exemplifies a well-known array formula for calculating unique values in a range. The COUNTIF element subjects the A2:A6313 range of complaint ids to what are in effect criteria furnished by each and every record. Thus each of the four instances of id 15-0001 are assessed against every id entry, four of which of course happen to present the selfsame 15-0001. Thus each instance here evaluates to a count of 4, and the formula’s “1/ “ numerator reduces each to ¼ – and by adding 4 1/4s a 1 is returned – tantamount to treating 15-0001 as a single instance. That reciprocal routine is applied to each and every value in column A and then summed – yielding in our case 2779. Divide that outcome into the field’s 6312 records and we wind up with average of 2.24 allegations per complaint. (It should be added that Excel’s dynamic-array UNIQUE function would streamline the approach on which I’ve embarked here, but the dynamic arrays remain behind a locked door somewhere in Redmond, and I have no idea when the key will be found. Note as well that the dynamic arrays will only download to the Office 365 iteration of Excel.)
But that average, however informative, doesn’t apprise us of the number of actual, discrete officers implicated by each complaint, because the same officer is often cited for multiple allegations laid to the same complaint. Again, for example, complaint 15-0001 and its four allegations actually identify but two different officers – and that is the number we’re seeking here, as it would go on to contribute to a real officer-per-case average.
One way – an inelegant one – for getting there would be to pour the data through the Remove Duplicates sieve, selecting the complaint_id and officer_id fields for the duplicate search. Click through and you’ll wind up with exactly 4700 unique, remaindered records, of which 313 are blank, however; and we can’t know how many of those ciphers do, and do not, point to a given officer but once per complaint. On the other hand, because most officers are in fact identified we can acceptably assume that for those complaints directed at multiple officers the unknown party is likely not the one(s) who is named. That supposition can’t dispel all our questions, of course, but divide 4700 by the 2779 unique complaints we derived above, and we learn that 1.69 distinct officers fell under investigative scrutiny per case – although the real quotient is probably a bit smaller.
In any event, that figure emerges at the cost of dismissing 1600 records from the data set, after which can we subject the stragglers to a formula, e.g.
{=COUNTA(B2:B4701)/SUM(1/(COUNTIF(A2:A4701,A2:A4701)))}
Inelegant indeed. For a sleeker alternative, we could first concatenate the complaint and officer ids in a new field in column I that I’m calling complaintofficer, e.g. in I2:
=A2&B2
That step positions us to cull unique officer ids by case; by running the unique-record array formula at these data we should be able to emulate the 4700 total and divide it by the other unique-finding expression aimed at the complaint ids:
=SUM(1/COUNTIF(I2:I6313,I2:I6313))}/{=SUM(1/COUNTIF(A2:I6313,A2:I6313))}
Elegance is a relative term, mind you, but it works.
On the other hand, if you wanted to develop a racial breakout of the number of individual officers charged with at least one complaint, you may here want to mobilize a Remove Duplicates by the po_race variable, because the breakout comprises multiple items (i.e. “races”; and if you adopt this tack you could save the results under a different file name, thus conserving the original, complete data set). That sequence yields 2549 separate officers, and conduces toward this pivot table:
Rows: officer_id
Value: officer_id
officer_id (again, by % of Column Total)
I get:
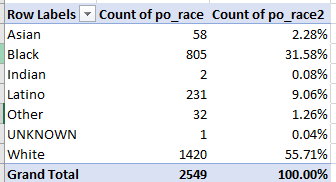
Now of course the proportions tell us little, because we need to spread them atop the racial makeup of the Philadelphia police force before any exposition can rightly commence. Note by the way that only one UNKNOWN officer informs the count here, even as we earlier turned up 313 such blank records; that’s because, of course, all the unknowns have the same blank, “duplicate” id.
Returning to the data set in toto, we can distribute allegations by their varieties. Remember of course that the 2779 complaints have accumulated an average of 2.24 charges, but each charge is exactly that – a complaint in its own right. Thus this conventional pivot table:
Rows: allegations_investigated
Values: allegations_investigated
Allegations_investigated (again, % of Column Total)
reports:
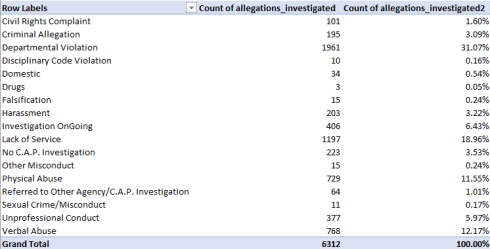
Apart from the indefiniteness of the modal Departmental Violation type, we need to recall that our previous post numbered 2782 such allegations populating the ppd_complaints workbook we reviewed then. It’s seems clear that the count enumerated there imputed but one allegation per complaint, a coarser take on the data than the more detailed table we’ve just minted above. In the earlier sheet, for example, Departmental Violations contribute 24.05% of all complaints; here they amount to 31.07%.
We also need to explain why our array formula here totaled 2779 unique complaint ids, when the count in ppd_complaints came to 2782. In that connection I simply copied the already-unique ids in the ppd_complaints to a new sheet, and directed a Remove Duplicates to ppd_complaint_disciplines keyed to the same field there, and copied these as well to the new sheet. Scrolling about and doing some due diligence, I did find a few discrepancies, e.g. an absent 15-0176 among the ppd_complaint_disciplines ids.
But what’s a mere three records between spreadsheets?

Leave a comment