We’ll score its acronym somewhere between Satisfactory (2) and Requires Improvement (3), but OFSTED – the UK’s Office for Standards in Education, Children’s Services and Skills – lifts a massive, watchful umbrella over the nation’s schools, by adjudging the quality of each and every institution across the Kingdom with regularized, internet-available inspections and recommendations for improvement.
OK – it should have been called something like OFSTEDCSS, but that handle is impossible to pronounce and would have to be rated Inadequate (4), and an educational agency mustn’t have that. In any event, OFSTED makes a great deal of its inspection data available to the likes of you and me in spreadsheet form, including this workbook, the sweetly-titled
06_1303_Most_Recent_31_Dec_2012_(Provisional)
which unrolls inspection outcomes for over 21,000 UK schools, breaking the data out by school type, local educational authority, and parliamentary constituency, in addition to the ratings themselves and hyperlinks to the school reports brocading column A.
In fact, the workbook leaves me slightly guilt-ridden, because its structural blueprint and data worthiness are, apart from a trifling mandate to auto-fit its columns, rather robust, hushing the litany of complaints I was about to intone over the whole thing. But leaving my neurosis aside, with 21,000+ records and some tasty parameters you can get right to work angling the data this way and that, because there are some interesting things out there to be learned.
The first thing you need to know about the school scores registered in columns O through T is what the numbers actually mean, and don’t mean; and thanks to a kindly OFSTED e-mail responder I have been properly edified. The score options comprise:
1- Outstanding
2- Good
3- Requires Improvement
4- Inadequate
9- Key Stage not inspected
And these mean, among other things, that that you have to suppress those 9s from any and all numeric operations, because they’re not meant to behave like values; these can be permanently deposed by simply selecting columns P through R (the other score columns are free of 9s) aiming a Find and Replace at the data, i.e., Find 9 and Replace with nothing (you’ll note that the column Q-placed data, How well do learner [sic] achieve?, is overrun with 9s.)
And once you’ve deloused those contaminants from the numbers, you can start to play with the data seriously. Here are but a few possibilities.
It has been noted that a recent bracing of inspection standards has dampened aggregate school evaluations. We can toss that suggestion into a pivot table and see what we shall see, e.g.:
Row Labels: Inspection end date (group selection by years)
Values: Overall effectiveness: how good is the school (by Average, with desired formatting)
Overall effectiveness (again, this time organized by Count)
I get:

That’s pretty suggestive indeed. Overall effectiveness scores have indeed successively faltered (remember that lower scores attest weaker performance) – and the sample is pretty large, too. But note the 173 schools that were last inspected in 2006, all of which received the maximum 1 – and that, at first blush, is a most emphatic skew. But that anomaly –and indeed perhaps the entire score trajectory – may be at least in part explained by this Wikipedia entry:
Schools rated Outstanding or Good might not be inspected again for five years, while schools judged less favorably were inspected more frequently, and might receive little or no notice of inspection visits.
In other words, the apparent correlation between strength of school and recency of last inspection may have something, but by no means everything, to do with the general decrement in scores.
And just as the data feature an Inspection End Date, they likewise report a start date. In fact the great majority of schools received their going-over in either one or two days, but it might be proper to wonder if that one-day disparity in any way comports with evaluations. To find out, you can interject a column between L and M, call it Inspection Days, and…but I know what you’re thinking. What if an inspection team convenes at a school on a Friday and continues its survey on Monday? Subtracting Inspection Start Date from Inspection End Date will thus yield an unambiguously wrong 3 (once the results have been treated to the standard Number format, that is). That’s surely what will happen, but Excel has anticipated that conceptual snarl and dusted off an alternative – the NETWORKDAYS function, which looks like this:
=NETWORKDAYS(start date,end date)
NETWORKDAYS proceeds to only count the weekdays spread between the start and end dates, along with the start and end dates themselves. (NETWORKDAYS should be read Net workdays, not Network days, by the way.) Thus you can enter
=NETWORKDAYS(K2,L2)
in what is now M2, format to Number, zap the decimals, and copy down the column.
Then drag your fields accordingly:
Row Labels: Inspection Days
Overall effectiveness, etc.: (Average, with formatting)
Overall effectiveness, etc., again: by Count
You should see:
Interesting. Ignore the outliers and observe the substantial rating differential between schools subject to one and two-day inspections. Of course that evaluational margin needs to be interpreted with all due care, but one could reasonably speculate that many schools deemed outstanding were so convincingly first-class that the inspectors decided to dispense with a second look.
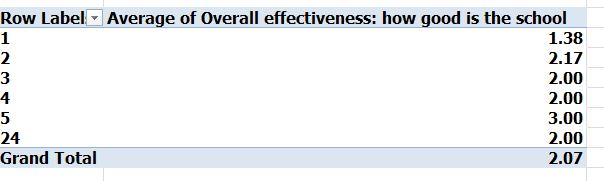
On the other hand, try this variation:
Row Labels: Inspection End Date (grouped again by years)
Values: Inspection Days (Average)
Inspection Days (Standard Deviation; you can access this option via PivotTable Tools > Summarize Values As > More Options > StdDev):

We see here that nearly all the 2010 and 2011 inspections spanned two days, irrespective of school rating. Our analysis then is, as with most “sociological” phenomena, multivariate. Does that pronouncement sound like an explanatory cop-out? Sure it does, but give me a tenure-bearing position at your favorite university and I’ll see what I can do with it.
But anyway, there’s a glut of data permutations waiting to be loosed from the OFSTED warehouse. Give it a go; you’ll find it most…educational.

Leave a comment