Ask New Yorkers what they were doing at 4 o’clock in the morning on the night of October 12, 2017 and they’ll tell you they a) don’t remember or b) won’t answer on the advice of counsel. But no matter – we know exactly what one intrepid iconoclast was doing at that hour – walking towards Manhattan on the Brooklyn Bridge.
That solitary – and courageous – wayfarer will be happy to know we have no more information about him, or her; all we know is that he – or she – was sighted and duly recorded by the Brooklyn Bridge Automated Pedestrian Demonstration Project, an initiative of New York’s Department of Transportation.
Squirreling an electronic counter somewhere on the Manhattan-side approach to the storied bridge the project gathered footfall data for both directions through the October 1 2017-July 31 2018 span (I’ll own up to the pun) and walked them over to New York’s open data site here (click the Export button on the screen’s far right and tick the relevant CSV option).
Our solo nightwalker presages a dataset that is nothing if not intriguing, even as it exhibits a few organizational curiosities. Apart from column A’s all-but-standard need for a widening via auto-fit (its dates/times are authentically numeric, though) you’ll join me in declaring the contents of column B – comprising 7,296 citations of the phrase Brooklyn Bridge – slightly superfluous, and so eminently dispensable.
And much the same could be offered about the lat and long fields, each of whose cells deliver the same coordinate, presumably positioning the Brooklyn Bridge in its earthly locus. So too, the Location1 field restates its data all the way down, and in textual terms, no less. We’ve seen this sort of thing in any number of open datasets, and it’s proper to wonder why. One assumes some industry-wide download routine batches out these relentless uniformities but whatever the accounting, the data they produce aren’t needed and could be either deleted or ignored.
And there’s another corrective that merits a claim on our attentions. The numbers in the Pedestrian field for November 9 at 7 and 8 PM read 411 and 344 respectively, but the companion data in the Towards Manhattan and Towards Brooklyn cells – which when summed should equal the Pedestrian figures – report nothing but zeroes. And in view of the fact that the pedestrian numbers for November 9 at 6 and at 9 PM read 455 and 300, it seems clear that the count for 8 and 9 could not have amounted to nothing at all. I broached the discrepancy via emails to both the Department of Transportation and the New York open data site, but have yet to hear from either. For the moment, we have to proceed with four empty cells.
And there’s something else, a data-organizational failing that could, and should, be righted, and one we’ve encountered in previous posts. Because the Towards Manhattan and Towards Brooklyn fields host data that are really of a piece and should be treated unitarily (the easier to calculate the percent of pedestrians by direction and date/time, for example) they should migrate their holdings to a single parameter (which I’ll call Direction), via the Get & Transform Data routine with which we’ve recombined other datasets. Start by selecting both Towards Manhattan and Towards Brooklyn and continue per these instructions.

The Get & Transform alternate take then also frees us to delete the Pedestrian field, because the new amalgamated Direction brings along with it a Value (I’ll rename it Sum) column that totals the Brooklyn/Manhattan numeric data by each date/time entry, thus superseding Pedestrian. Of course the new dataset (presenting itself in table form) comprises twice as many records as its progenitor, because each Towards Manhattan and Brooklyn notation now populates the new Direction field with an individual record instead of the previous parallel fields populating the same record; but that trade-off is well worth the price.
Once that extended preliminary chore completes its work we can try to make some sense of the all that fancy footwork on the bridge. We could start by pivot tabling pedestrian totals by hour of the day:
Rows: hour_beginning (group by Hours only)
Columns: Direct
Values: Sum
I get:

The two obvious attention-getters here are the exceedingly, but largely predictable, fluctuations in foot traffic by hour, and the direction of that movement. Note the grand totals as well: over 5 million unidirectional trips launched across the ten-month project period – about 16,500 a day, or approximately 8,200 discrete, carless (don’t read careless) New Yorkers opting for the scenic route over the East River, assuming of course they walked the walk both ways. And if you’re wondering about 4AM, we find around 5.6 average crossings ventured at that hour – even though that hardy coterie probably could have gotten a seat on the subway, then, too.
And consider the literal back and forth of the walkers’ directional proportions. 3PM (that is, the hour running through 3:59), attracted the most pedestrians, closely flanked by 2 and 4PM; and though I doubt the reasons for the hours’ appeal are particularly mysterious, I don’t know what they are. An optimum time for a mid-afternoon stroll? A cadre of workers perambulating home from their early shift, or setting out on their way to a late one? I doubt it, but research on the matter awaits.
And what of the 8AM hour, in which walks toward Brooklyn far outnumber trips to Manhattan? I would have thought – wrongly – that the press of rush hour would have drawn Brooklynites toward Manhattan in predominating numbers, but we’ll have to look elsewhere for an explanation. But by 9AM the flow reverses, rather pronouncedly and curiously.
Now the above table might read more crisply by removing the grand totals for rows (while retaining them for columns) and spinning the numbers through the Show Values As > % of Row Total grinder (remember that this prospect has been enabled by the Get & Transform protocol):

Thus we see 58% of the 8AM traffic heading toward Brooklyn, with a pull-back to 44.71% by the next hour – a dramatic, and analytically provocative, reversal.
And what about pedestrian accumulations by day of the week? Common sense allows that weekend totals should be the greater, and that conjecture dovetails with the truth. But extolling common sense won’t do much for your byline; you’ll need to substantiate the finding with a wee bit more precision. Start by introducing a new column to the immediate right of hour_beginning, call it Weekday and enter in what should be B2:
=WEEKDAY(A2)
(If you click on A2 in order to emplace that cell reference in the formula, Excel with respond with a table structured reference; but the result will be identical).
And because the dataset has assumed table form, the formula will instantly copy itself down the B column.
Then try:
Rows: Weekday
Values: Sum
Sum (again, this time % of Column Total)
I get:
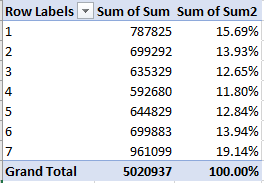
(You’ll want to rename the headers. Remember as well that 1 signifies Sunday, 7 Saturday.)
Common sense prevails, though I hadn’t foretold Saturday’s substantial edge over Sunday.
But nor did I expect to find someone on the Brooklyn Bridge at 4 in the morning. I want to see the selfie.

Leave a comment